

Key Takeaways
- Healthy CTR/CPC/MQLs don’t mean healthy CAC — those are activity metrics, not efficiency metrics.
- Rising CAC usually starts downstream: qualification, sales cycle, win rate, or attribution.
- Fully loaded and cohort CAC catch what platform CPA misses.
- Diagnose the broken funnel stage before cutting spend.
- Rising CAC only matters if it breaks profitable growth economics.
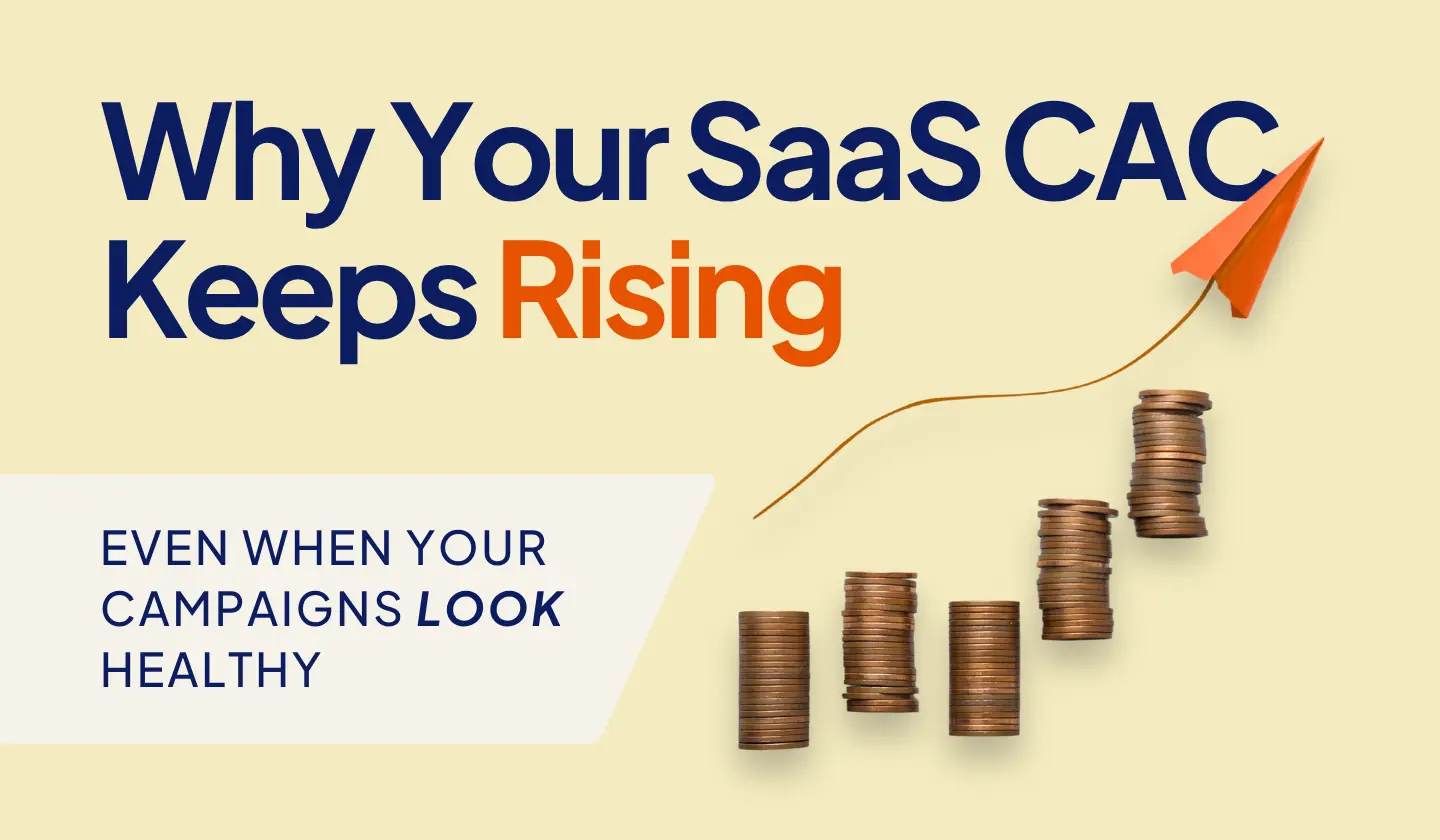
SaaS CAC can rise even when campaign metrics look healthy because CTR, CPC, and MQL volume measure activity, not pipeline efficiency. The actual driver is usually downstream: a widening gap between MQL and SQL conversion, attribution misattributing credit across channels, or a sales cycle that’s lengthened without CAC’s measurement window adjusting for it. Checking channel-level metrics alone won’t surface these problems — they show up only when MQL-to-SQL rates and multi-touch attribution are reviewed alongside spend.
Your ads may still hit their targets. CPC may barely move. Leads may keep arriving. Yet finance reports a higher SaaS customer acquisition cost because campaign performance and acquisition efficiency measure different layers of the same growth system.
The right response is not automatically cutting media spend. It is finding where efficiency actually broke between the first impression and closed-won revenue.
Why SaaS CAC Can Rise While Campaign Metrics Look Healthy
Campaign performance is not the same as acquisition efficiency. Ad platforms primarily measure what happens near the top of the funnel, while CAC reflects the performance of the entire customer acquisition system.
The real chain looks more like:
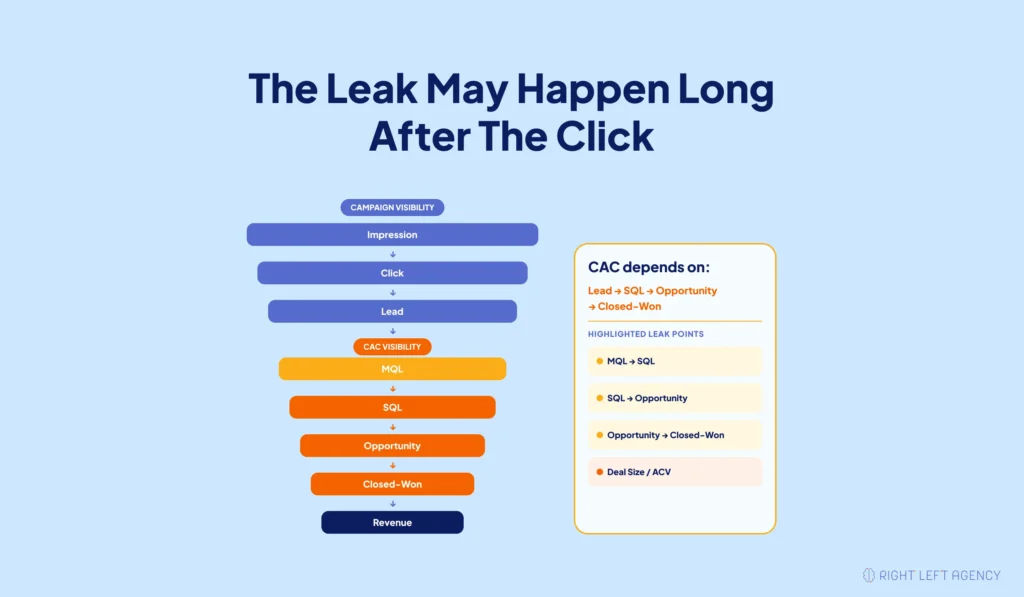
CTR may stay strong through the first two steps. CPL may stay stable through the third. But CAC can still climb if fewer leads become SQLs, fewer opportunities close, deals take longer to close, or customers arrive at lower ACVs.
That is why looking only at CPC, CPL, or platform CPA can hide a serious efficiency problem.
For example, if CPL remains unchanged but the SQL conversion rate falls, you now need more leads to generate the same number of qualified opportunities. Media performance looks healthy while cost per qualified opportunity and CAC deteriorate.
First, Make Sure You Are Calculating SaaS Customer Acquisition Cost Correctly
Before diagnosing rising CAC, confirm that the number itself is reliable. Inconsistent definitions, missing costs, or mismatched time periods can make CAC appear better or worse than it really is.
Fully Loaded CAC Formula
Fully loaded CAC measures the complete sales and marketing investment required to acquire paying customers.
A practical formula is:
Fully Loaded CAC = Total Sales and Marketing Acquisition Costs ÷ New Customers Acquired
Relevant costs can include:
- Paid media
- Marketing and sales salaries
- Agency fees
- Sales commissions
- Creative production
- Marketing and sales software
- RevOps costs
- Relevant sales and marketing overhead
SaaS CAC should include sales salaries when calculating fully loaded acquisition economics. Looking only at ad spend produces a media-efficiency metric, not true business CAC.
CAC vs. CPA vs. CPL
CAC, CPA, and CPL answer different questions and should not be used interchangeably.
| Metric | Includes | Best Use |
|---|---|---|
| CPL | Campaign spend ÷ leads | Media |
| CPA | Campaign cost ÷ platform conversion | Campaign |
| Marketing CAC | Marketing cost ÷ customers | Marketing |
| Fully Loaded CAC | Sales + marketing cost ÷ customers | Business |
| CAC Payback | Months to recover acquisition cost | Finance |
CPL tells you what generating a lead costs.
CPA depends on whichever conversion event the platform defines as an acquisition.
CAC tells you what acquiring an actual paying customer costs.
A low CPA does not guarantee a low CAC if those conversions fail to become customers.
Blended CAC vs. Channel CAC
Blended CAC shows the overall economics of acquiring customers across your growth system. Channel CAC attempts to isolate acquisition efficiency by source.
Both matter.
Blended CAC can hide a channel that is deteriorating because stronger channels compensate for it. Channel CAC can also become misleading when attribution cannot reliably assign customers to a single source.
Segment CAC where possible by channel, ACV tier, inbound versus outbound, and self-serve versus sales-assisted motions. Then use blended CAC to understand the overall business outcome.
Why Same-Month CAC Can Mislead You
Same-month CAC can distort performance when your B2B SaaS sales cycle extends across several months.
Customers closing in August may have originated from campaigns funded in May or June. Dividing August acquisition costs by August customers therefore mixes different acquisition cohorts.
Lag-adjusted or cohort CAC solves this by matching acquisition investment to the customers that investment eventually produced:
Cohort CAC = Acquisition costs attributable to a cohort ÷ Customers eventually acquired from that cohort
This becomes increasingly important as sales cycles lengthen. Strong SaaS marketing attribution should account for these timing and touchpoint differences.
CAC is not LTV: CAC or CAC payback. CAC measures what acquiring the customer cost. Churn can reduce LTV and worsen payback economics later, but it does not change the historical mathematical cost of acquiring that customer.
7 Reasons CAC Rises Even When Campaigns Look Fine
When top-of-funnel metrics remain stable, work systematically through the stages between lead generation and revenue.
1. Your Campaign Is Generating Leads, Not Qualified Pipeline
Lead volume can remain strong while CAC rises if fewer leads become qualified sales opportunities.
The missing middle metric is often cost per qualified opportunity (CPQO). If CPL stays flat while MQL-to-SQL or SQL-to-opportunity conversion falls, acquisition efficiency is already deteriorating.
Instead of asking whether campaigns generated enough leads, examine whether those leads consistently become qualified pipeline.
This is closely connected to your SaaS MQL-to-pipeline process.
2. Your ICP Is Drifting as You Scale
CAC often rises when increased budget forces campaigns beyond the audience segments that produced your strongest early results.
The additional leads may still convert on forms, keeping CPL attractive, but they can have weaker fit, lower intent, smaller potential ACV, or lower close rates.
Compare the customers being acquired now with the ICP segments that produced stronger economics previously. More reach does not automatically mean more efficient growth.
3. Post-Click Conversion Is Quietly Eroding
CAC can climb when the experience between the click and qualified opportunity becomes less efficient.
The breakdown may happen on the landing page, form, qualification flow, demo request, or handoff into sales. Small conversion losses across several stages can compound significantly by closed-won.
This is why examining why qualified traffic doesn’t become pipeline matters before blaming the advertising channel itself.
4. Your Sales Cycle Is Getting Longer
A longer sales cycle can increase acquisition costs even when lead generation remains unchanged.
Longer cycles create additional nurturing, SDR follow-up, sales involvement, software usage, and operational overhead before revenue arrives. They can also make same-period CAC calculations appear worse because current costs and current customers no longer belong to the same acquisition cohort.
Track sales-cycle length alongside CAC rather than treating it as a separate sales metric.
5. Win Rate or Deal Size Is Falling
CAC deteriorates when fewer qualified opportunities become customers, even if campaign performance remains healthy.
A falling win rate means you must generate more opportunities to acquire each customer. Lower ACV also reduces revenue quality: acquiring a smaller customer at the same acquisition cost produces weaker unit economics.
Review opportunity volume, win rate, and ACV together instead of optimizing only for acquisition count.
6. Your Measurement System Is Crediting the Wrong Things
CAC can appear distorted when the measurement system does not accurately connect marketing activity to customers.
Common problems include wrong conversion events, missing offline conversions, CRM and ad-platform discrepancies, last-click bias, and demand created through dark social receiving little or no credit.
GA4, Google Ads, LinkedIn Ads, HubSpot, Salesforce, and your CRM should not tell completely different acquisition stories.
If they do, revisit SaaS marketing attribution before making major budget decisions.
7. You Have Hit Diminishing Returns
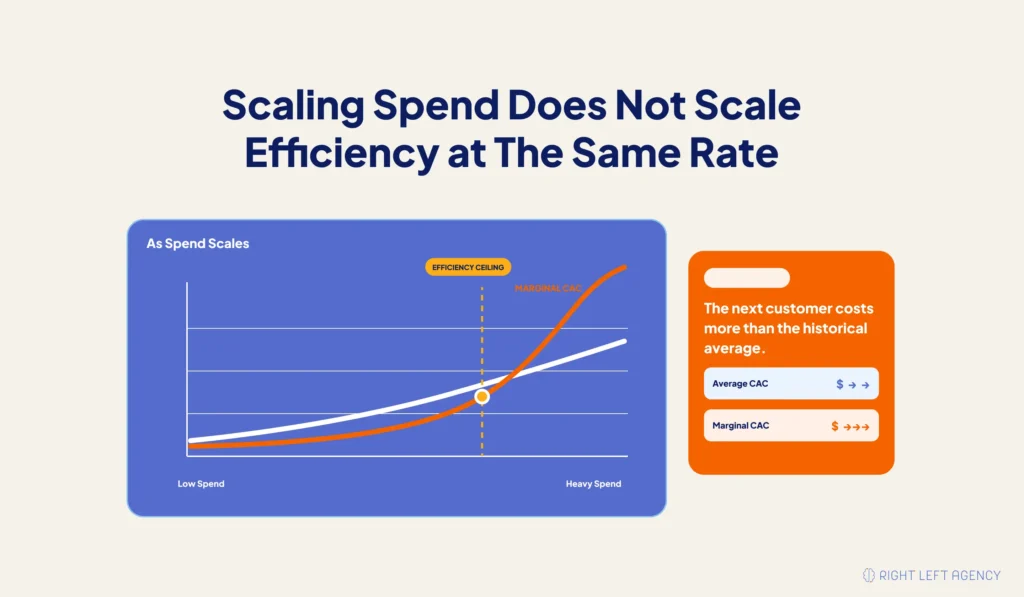
Scaling spend rarely preserves the historical average CAC indefinitely.
Average CAC describes what previous customers cost. Marginal CAC estimates what acquiring the next incremental customer costs.
As strong audiences become saturated, additional budget may reach progressively weaker segments or increasingly expensive inventory. Average CAC can therefore look acceptable while marginal CAC has already crossed your economic ceiling.
That is why campaign health metrics don’t equal efficiency when deciding whether more spend will produce efficient growth.
The SaaS CAC Diagnostic: Find the Leak Before Cutting Spend
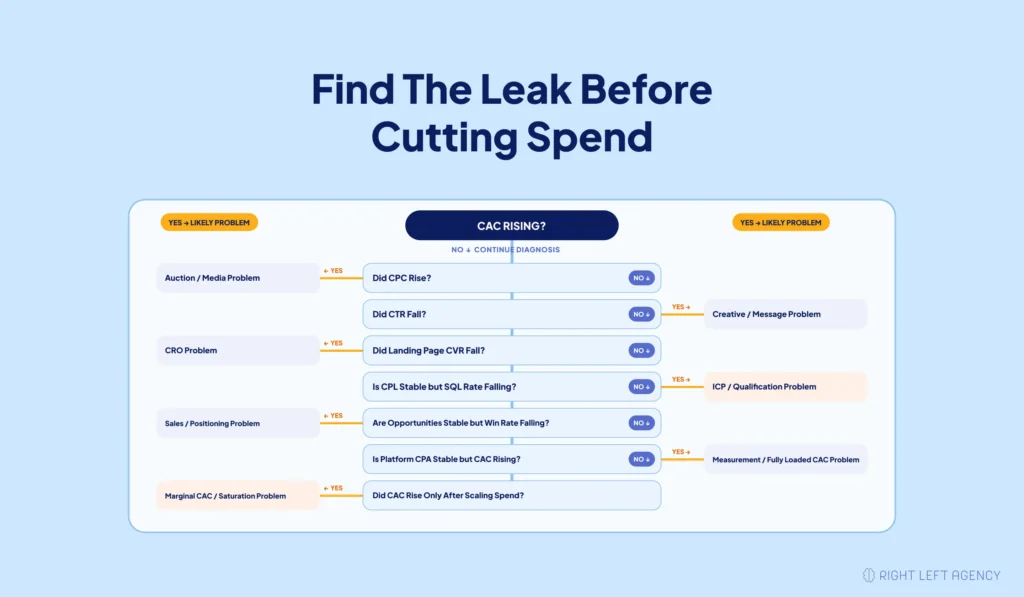
| If This Changes | Check This | Likely Problem |
|---|---|---|
| CPC rises | Auction/competition | Media |
| CTR falls | Creative/message | Ads |
| Landing-page CVR falls | Message/page | CRO |
| CPL stable but SQL rate falls | ICP/qualification | Targeting |
| SQL stable but opportunity rate falls | Fit/discovery | GTM |
| Opportunities stable but win rate falls | Positioning/proof/sales | Downstream |
| Platform CPA stable but CAC rises | Measurement/full-load | Finance/RevOps |
| CAC stable until scaling | Marginal CAC | Saturation |
If the evidence points toward media efficiency, start by auditing your Google Ads account before increasing spend. If the problem begins after the click, investigate conversion, qualification, sales, or measurement before changing bids.
What Metrics Should You Track Alongside CAC?
Track acquisition metrics in funnel order so you can see where economics begin deteriorating:
- CTR and CPC — ad and auction performance
- Landing-page conversion rate — post-click performance
- CPL — lead-generation efficiency
- SQL rate and cost per SQL — qualification quality
- Opportunity rate — pipeline creation
- Cost per qualified opportunity — middle-funnel acquisition efficiency
- Win rate — opportunity-to-customer efficiency
- ACV — revenue quality
- Sales-cycle length — time and operating burden
- Fully loaded CAC — customer acquisition economics
- CAC payback — recovery speed
- LTV: CAC — long-term unit economics
CAC tells you the result. These metrics help explain why that result changed.
How to Reduce SaaS CAC in the Right Order
Reducing SaaS CAC starts with diagnosis, not isolated optimization tactics. Sequence matters because improving the wrong stage can create more activity without improving customer economics.
- Validate your CAC measurement. Confirm cost definitions, attribution, and cohort timing.
- Identify the first broken funnel stage. Find where conversion changed before CAC increased.
- Tighten ICP and lead quality. Stop paying for leads unlikely to become opportunities.
- Improve post-click conversion. Fix landing pages, forms, qualification, and handoffs.
- Improve opportunity and win rates. Address fit, positioning, proof, discovery, and sales execution.
- Repair attribution and RevOps measurement. Connect campaigns with qualified opportunities and closed-won revenue.
- Diversify demand sources. Balance paid demand capture with organic and other demand-creation channels.
- Scale only when marginal economics work. Evaluate what the next customer costs, not only the historical average.
Once the acquisition system is healthy, use your SaaS marketing budget allocation process to determine where incremental investment should go.
When Should You Reduce Paid Spend?
Reduce paid spend when the evidence shows that incremental investment is destroying acquisition economics, not simply because the latest CAC report moved upward.
Reduce or reallocate spend when:
- Marginal CAC consistently exceeds your economic ceiling.
- CAC payback becomes unsustainable.
- Lead or opportunity quality continues deteriorating.
- Audience or channel saturation is clear.
- Additional budget produces progressively weaker pipeline.
Do not automatically reduce spend when:
- Cohort timing temporarily makes CAC look worse.
- Pipeline generated by recent spend is still maturing.
- A repairable downstream conversion stage is causing the increase.
- Fully loaded costs temporarily increased.
- Measurement or attribution remains unreliable.
You can often keep productive campaigns running while diagnosing a downstream issue. Cutting demand generation immediately can create a second problem without fixing the first one.
What Is a Good SaaS CAC?
There is no universal dollar amount that represents a good SaaS CAC. A sustainable CAC depends on how much profitable value each customer produces and how quickly acquisition investment is recovered.
Evaluate CAC using:
- ACV
- Gross margin
- CAC payback
- LTV: CAC
- Growth stage
- Sales motion
- Customer segment
- Acquisition channel
The often-cited LTV: CAC ratio should therefore be treated as a unit-economics signal rather than a universal rule.
CAC payback should also reflect your business model and cash constraints. A company with stronger margins, larger contracts, and more available capital can tolerate a different payback profile than a lower-ACV company with limited cash.
The better question is not, “Is our CAC above a benchmark?”
It is, “Does our CAC still support profitable growth at the next dollar of investment?”
Final Thoughts
Rising SaaS CAC does not always mean your campaigns are failing. The real issue may sit deeper in the funnel — in lead quality, conversion, sales efficiency, attribution, or diminishing returns.
Before cutting spend, validate how CAC is measured, identify the first stage where efficiency declines, and fix that bottleneck first. The goal is not simply to lower CAC, but to build an acquisition system that can scale without weakening pipeline quality or unit economics.
If the problem runs deeper than allocation, book a Growth Fit Call with Right Left Agency.
FAQs About Rising SaaS Customer Acquisition Cost
1. Why is SaaS customer acquisition cost increasing?
SaaS CAC usually rises because acquiring each closed customer requires more total sales and marketing investment. The cause may be weaker qualification, lower conversion, longer sales cycles, declining win rates, measurement problems, or diminishing returns.
2. Can CAC rise when CPC and CPL stay flat?
Yes. CPC and CPL measure earlier funnel stages, while CAC depends on customers acquired. If SQL rate, opportunity conversion, or win rate declines, CAC can rise without CPC or CPL changing.
3. What is the difference between CAC and CPA?
CPA measures the cost of a platform-defined action or conversion. CAC measures the sales and marketing cost required to acquire an actual paying customer.
4. Should SaaS CAC include sales salaries?
Fully loaded SaaS CAC should include relevant sales salaries alongside marketing costs. Excluding sales expenses understates the real business investment required to acquire customers.
5. How do long sales cycles affect CAC calculations?
Long sales cycles separate acquisition spending from the month customers close. Cohort CAC provides a clearer picture by matching acquisition costs with the customers those costs eventually generated.
6. Is a rising CAC always bad, or does it depend on LTV and payback period?
Rising CAC is not automatically bad if customer economics still support profitable growth. Evaluate the increase alongside gross margin, LTV: CAC, CAC payback, ACV, and marginal acquisition economics.
7. Should I pause spend while I investigate, or keep campaigns running during the diagnosis?
Not automatically. Keep productive campaigns running when the problem appears downstream or when pipeline is still maturing, but reduce or reallocate spend when marginal economics clearly become unsustainable.